Looking for Global training? Go to https://firebrand.training/en or stay on the current site (Sverige)
TERMS AND CONDITIONS
Firebrand Training grants you a personal, non-exclusive, non-transferable license to access and use the site. You may download or print material from the site only for your own personal, non-commercial use. Please read our full terms and conditions.
6.5 Estimate Activity Durations
"The process of estimating the number of work periods needed to complete individual activities with estimated resources."
The definition shown above in italics is taken from the Glossary of the Project Management Institute, A Guide to the Project Management Body of Knowledge, (PMBOK® Guide) – Fifth Edition, Project Management Institute Inc., 2013
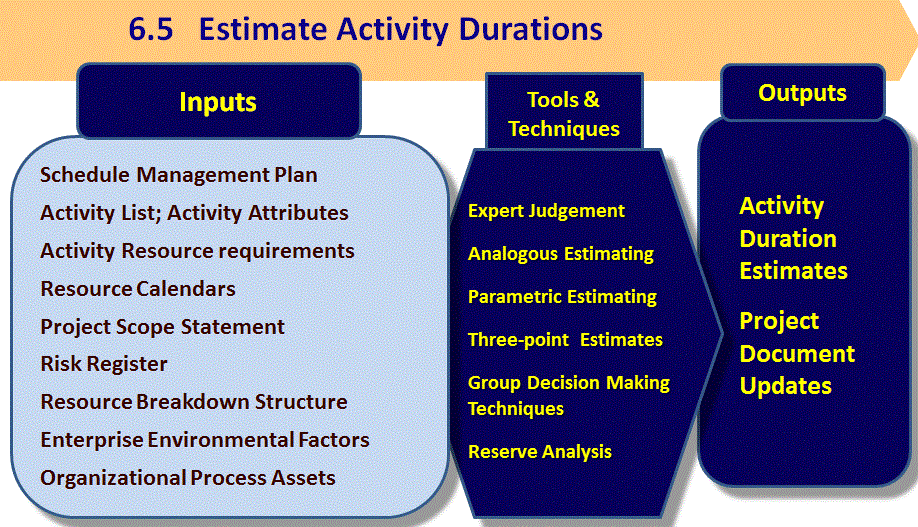
Project Management Institute, A Guide to the Project Management Body of Knowledge, (PMBOK® Guide) – Fifth Edition, Project Management Institute Inc., 2013 Figure 6-14 Page 166
Expert Judgement
Analogous: uses data from similar/past projects
Parametric:
- Using metrics or historical information we know that 50 bricks can be laid every hour
- Our construction estimator has said we need 5000 bricks for this wall, therefore we need 100 hours
3-point estimate or PERT
- Uses 3 estimates (optimistic (O), most likely (M), pessimistic (P))
- Triangular distribution = (O + M + P) / 3 – used infrequently
- Beta Distribution = (O + 4M + P) / 6 – use most often
How to estimate activity duration?
- Involve the team, project managers and work package owners.
- Examine historical information and previous practice
- Decide how you want to quantify the work
- Don‟t forget resource requirements and capabilities
- Determine which estimation method to use
- Modify constraints and assumptions from other planning processes
- Verify accuracy of estimates
- Consider the need for time reserves
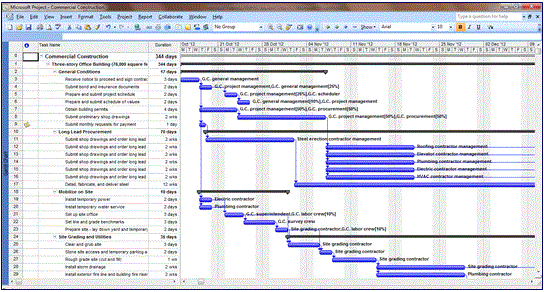
PERT Three Point Estimating
PERT technique (Project Evaluation & Review Technique)
Uses three estimates, to define an approximate range for an activity‟s duration
Σ = Expected Time or Expected Duration

O = Optimistic P = Pessimistic M = Most Likely
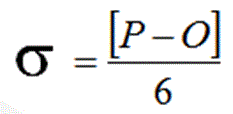
Sigma σ

The standard deviation of an activity
- Degree of variation from the average - (mean)
- Indicates the standard error in the estimate and provides an idea of its accuracy
- the larger the standard deviation (spread between the optimistic and pessimistic estimates), the larger the risk in the estimate
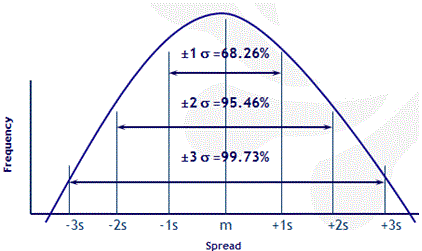
± 1 standard deviation = 68.26%
± 2 standard deviations = 95.46%
± 3 standard deviations = 99.73%
± 6 standard deviations = 99.999998% - also known as Six Sigma
Statistical Concepts
Normal distribution curve
- Standard Deviation = σ
- How close the data points (measurements) are to the mean (m) when plotted on a graph
Variance and Standard Deviation
Variance of the activity = square of the standard deviation = Sigma squared

Variance and the standard deviation measure variability, and are measures of how spread out a distribution is (from the mean)
Another term – heuristics (simple rule of thumb) – six sigma is an example
Question:
Your project has a critical path equal to 30 days and a standard deviation of 2½ days.
What will be the earliest finish and latest finish estimates for this project within a 95% confidence level?
Answer
The question gives you:
- a standard deviation of 2½ ,
- your confidence level is 95% which is two standard deviations,
- therefore you multiply the 2½ by 2 to get 5.
You add the resulting 5 to the project duration to give you the upper end of the variance range = 35
You subtract that 5 from the project duration to give you the lower end of the variance range = 25
Your answer:
- will be the option which states Earliest finish estimate of 25 and latest finish estimate of 35.
Exercise - Calculate…
The PERT Duration of the Critical Path Activities, Standard Deviation (σ), Variance (σ²), Project‟s PERT Duration, and Standard Deviation (σ Project =√ Σ variances))
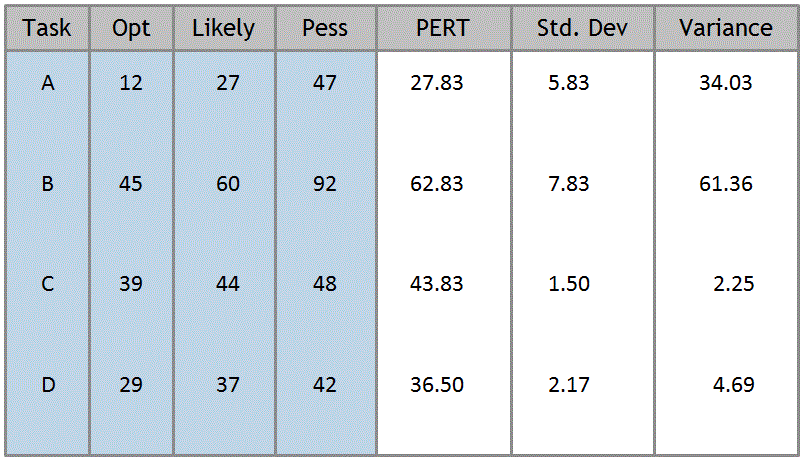
If all the activities above are on the Critical Path, what is the project’s mean duration and σ ?
Answer:
Project’s mean duration = 170.99 days and σ=10.1 days
DISCLAIMER
Firebrand Training grants you a personal, non-exclusive, non-transferable license to access and use the site. You may download or print material from the site only for your own personal, non-commercial use. Read our full terms and conditions on https://firebrand.training/se/learn/terms-and-conditions.
 Part of the BPP Education Group